Observing black-box services on my home server
I’ve been running a home media server / homelab for about six months now, running the usual bunch of services with Jellyfin to serve everything up. Besides a brief misadventure with Kubernetes, it’s been pretty reliable, and I don’t use a single streaming service anymore.
The only issue is that I’m a security analyst by trade, so I’m obsessed with making dashboards, and none of these services provide any metrics. Thankfully, there’s a way around that.
My server#
I run all my services on a Lenovo ThinkCentre M920T workstation tower that my work was getting rid of. It’s got an Intel i7-9700, 32GB of RAM, and I’ve slapped a random 2TB spinning rust disk in there for storing media - which is rapidly filling up, no thanks to rising disk prices…
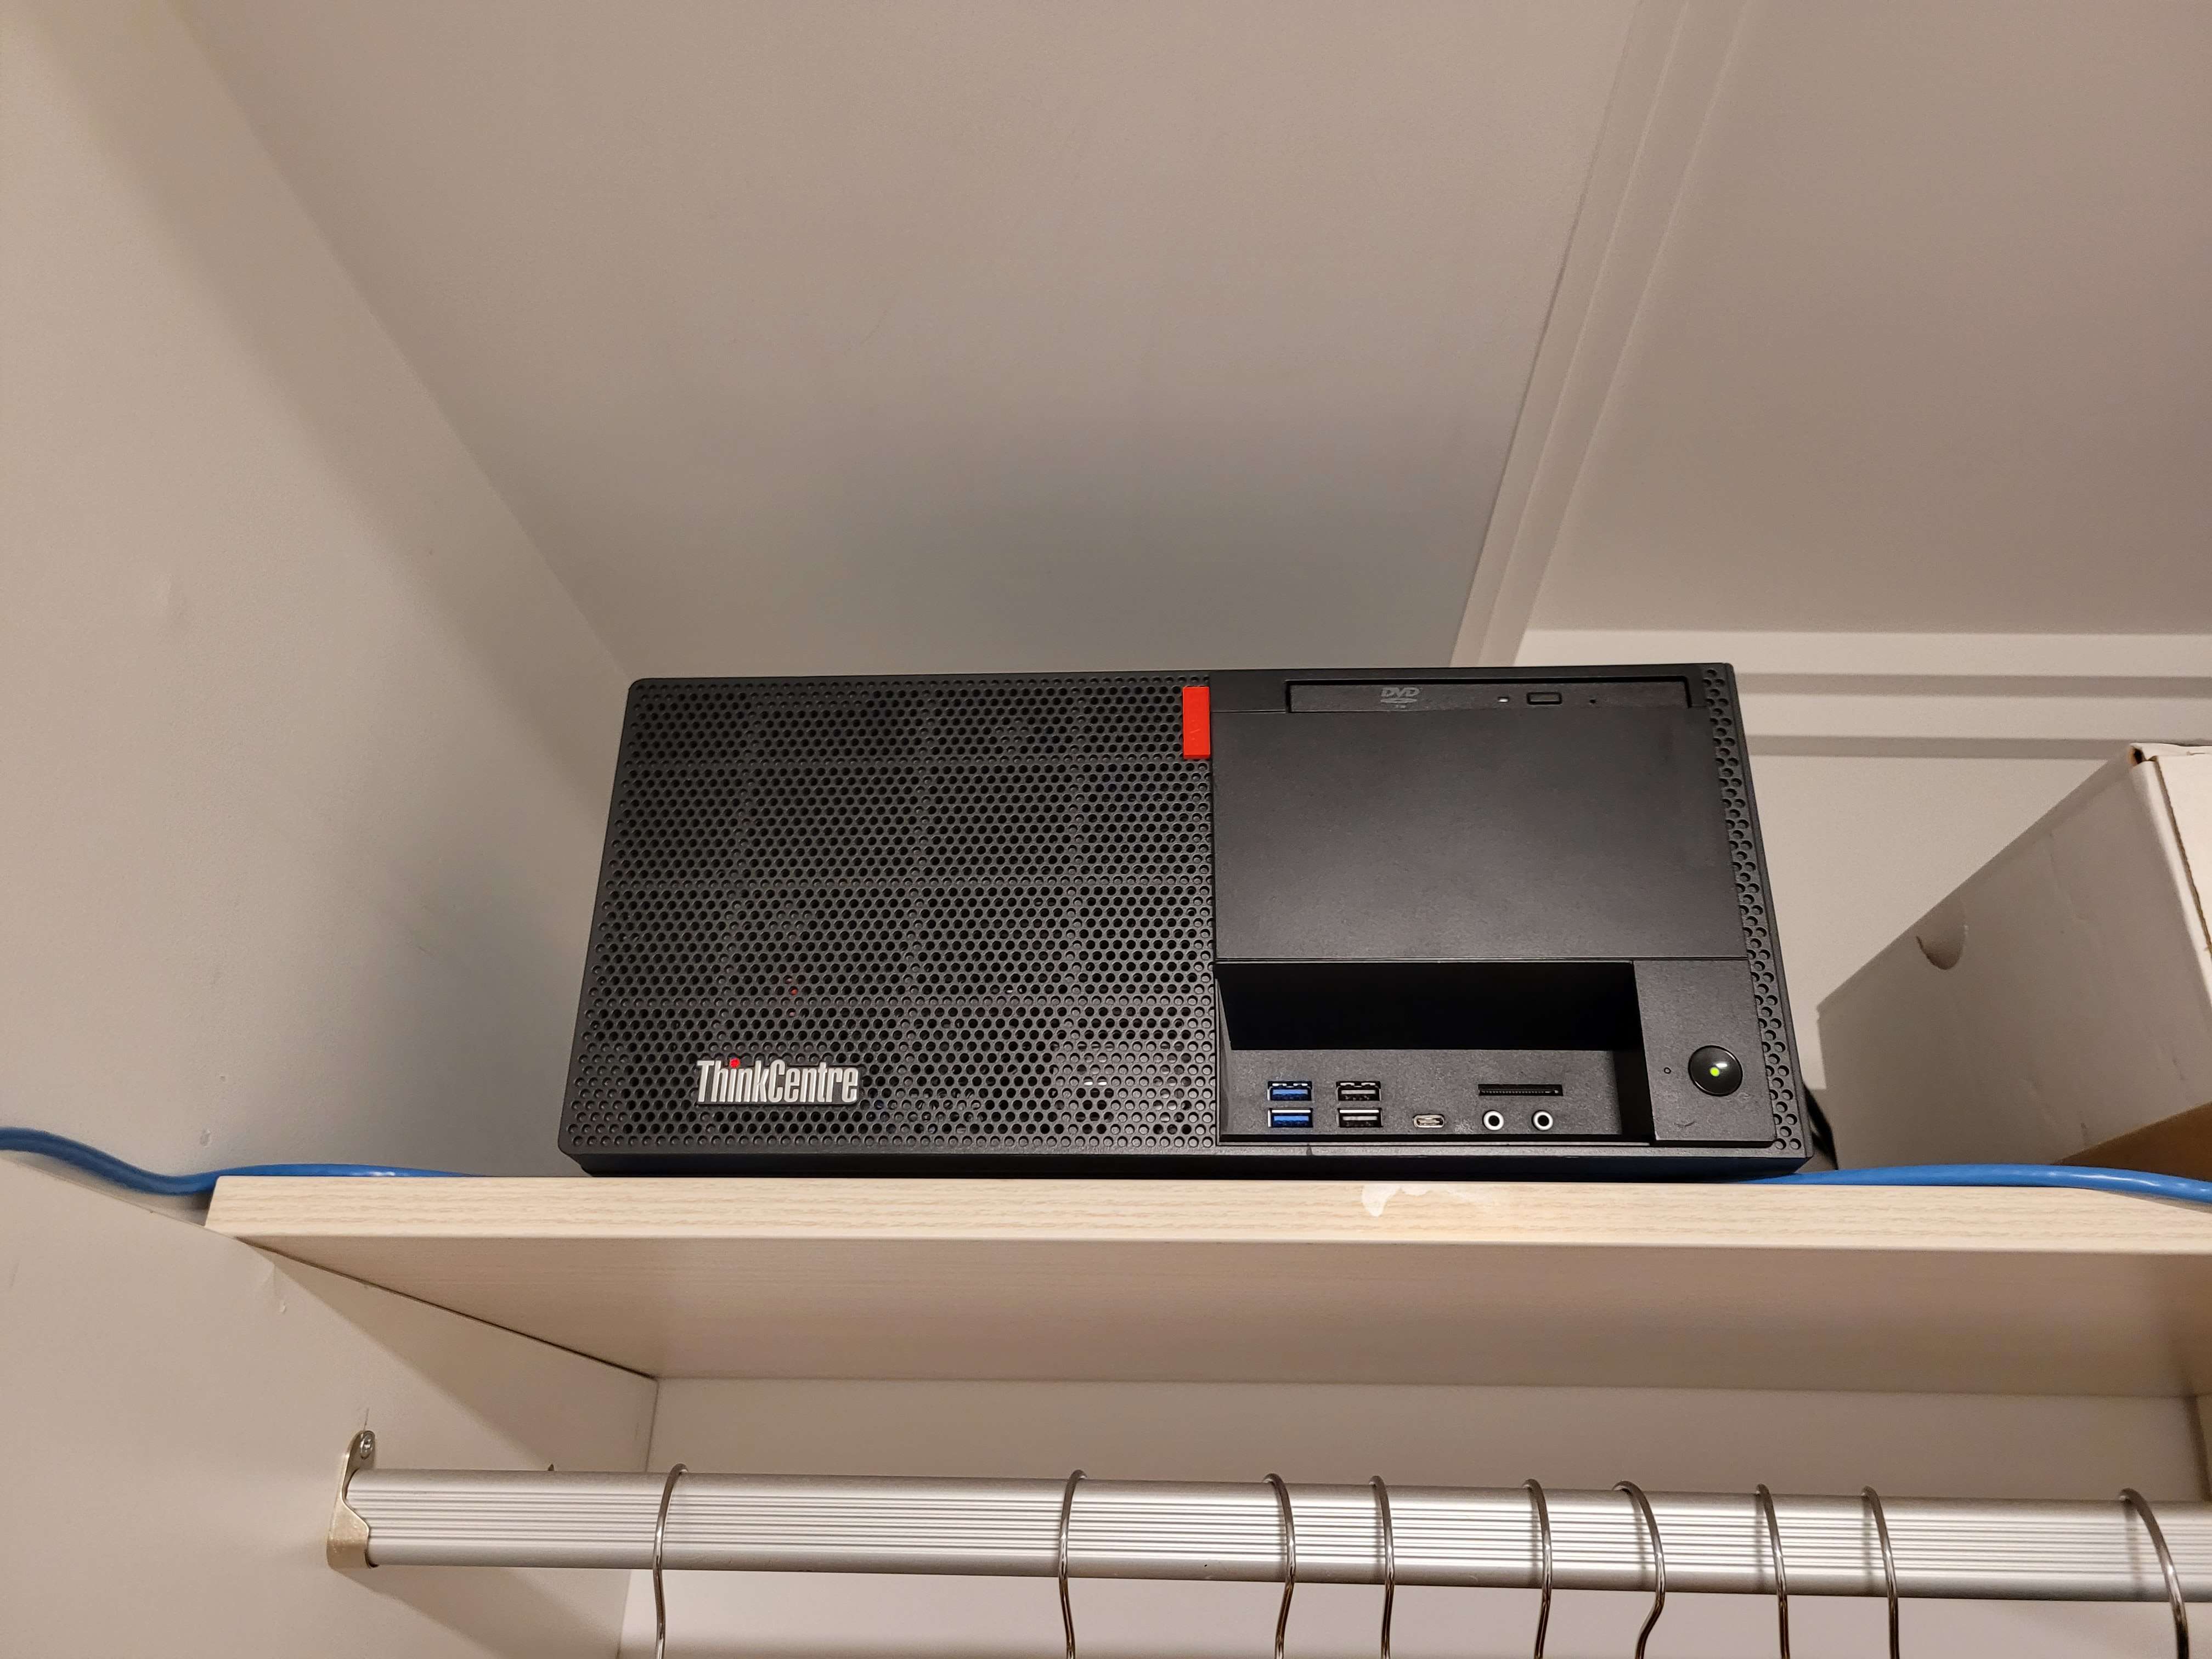
Perched in my “server room”
In any case, it has more than enough grunt to run everything I need. Right now, everything just runs as Docker containers on Debian, fronted by Caddy and CrowdSec.
Monitoring#
Before getting into the fancy black-box observability stuff, I want to provide an overview of what I use to actually store everything.
For all my monitoring and dashboarding needs, I use bits and pieces of Grafana Labs’ open-source stack - namely Grafana itself, Alloy, Loki, and Tempo:
- Grafana, as you probably know, is for querying and dashboarding with the telemetry DBs.
- Alloy is Grafana’s distribution of the OpenTelemetry Collector - all my telemetry data goes through Alloy, then is shipped off to the DBs.
- Loki stores all my log data.
- Tempo stores OpenTelemetry trace spans, and can generate metrics from them.
For metrics, I use plain old Prometheus instead of Grafana Mimir. I did run Mimir for a while (during that Kubernetes misadventure), and it’s great for high volumes of metrics, but I found it a bit difficult to operate at my scale.
With this setup, I have Alloy scraping metrics from anything exposing a /metrics endpoint (including pulling from cAdvisor and Node Exporter), pulling all the logs out of my Docker containers and the node, then shipping them off to Prometheus and Loki.
Tempo and Beyla#
I use Tempo almost exclusively for the black-box observability stuff - nothing I run offers OpenTelemetry traces by default. When paired with Grafana Beyla, I can shake out trace spans and metrics for services with no built-in observability features at all.
Beyla is another bit of Grafana Labs kit - and soon to be an official OpenTelemetry project - that uses eBPF to generate traces and metrics for applications by monitoring network traffic. For those unaware, eBPF is a Linux technology for loading small programs in the kernel at runtime, usually for networking-related tasks.
Beyla is built into Alloy, so with a bit of configuration, you can set it up quite quickly:
// run Beyla against services
beyla.ebpf "services" {
  ebpf {
    track_request_headers = true
    context_propagation = "all"
  }
  discovery {
    instrument {
      open_ports = "<PORT>,<PORT>"
      containers_only = true
    }
  }
  metrics {
    features = ["application", "network"]
  }
  output {
    traces = [otelcol.processor.batch.default.input]
  }
}

// scrape and ship off to Prometheus
prometheus.scrape "beyla" {
  targets = beyla.ebpf.services.targets
  honor_labels = true
  forward_to = [prometheus.remote_write.metrics.receiver]
}

// batch and ship off to Tempo
otelcol.processor.batch "default" {
  output {
    traces  = [otelcol.exporter.otlphttp.traces.input]
  }
}
You can point Beyla at any comma-separated list of ports, and it’ll automatically instrument them, spitting out trace spans and RED (Rate-Error-Duration) metrics. In this case, I’m only looking at executables running inside a container.
Traces#
With everything wired up, trace spans are now viewable in Grafana through the Traces Drilldown feature, including span metrics generated by Tempo: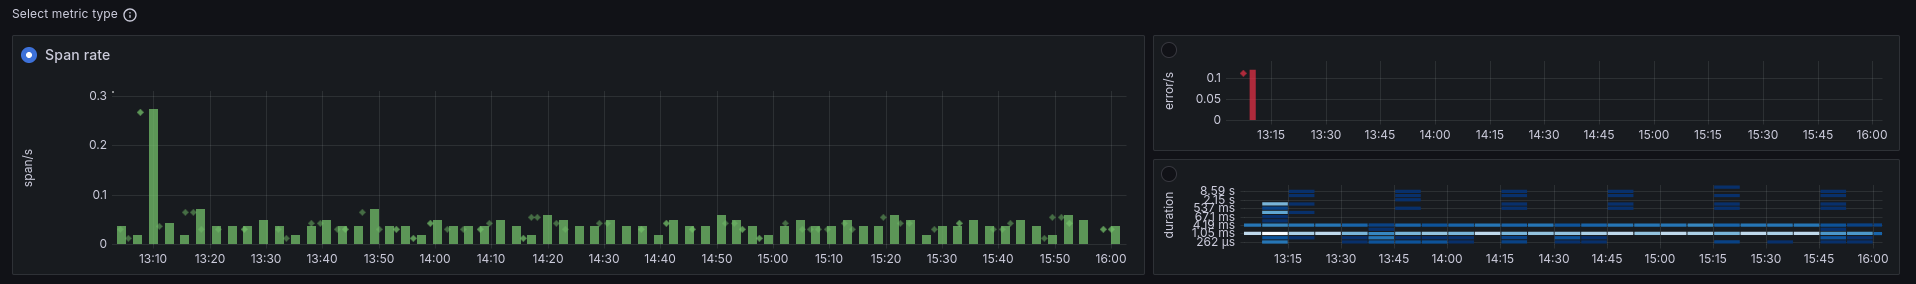
And trace spans themselves, including context propagation to other services: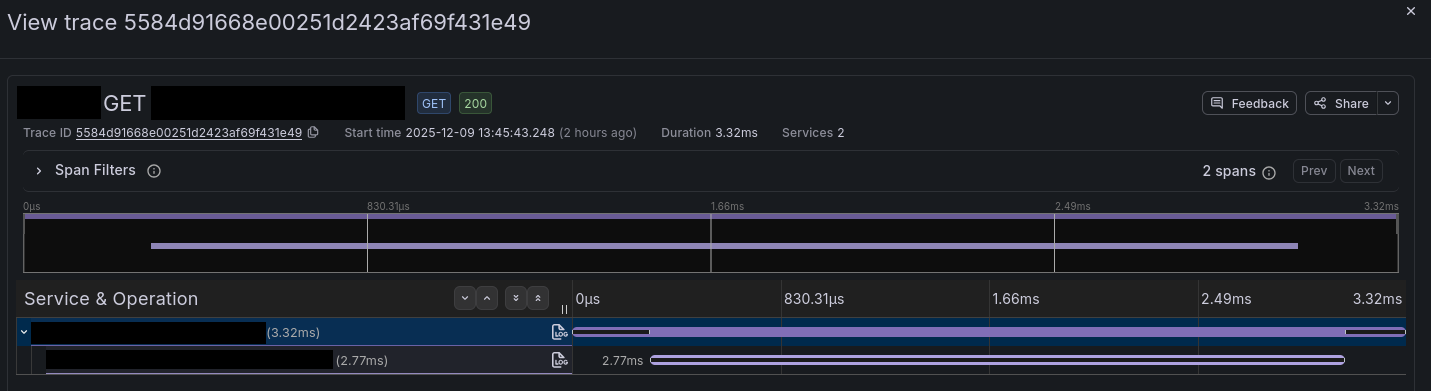
Metrics#
As previously mentioned, Beyla will generate RED metrics by looking at all the incoming and outgoing calls for each service you instrument - there’s a full list of the generated metrics available here.
Now that metrics are available, we can put them to use in dashboards - here’s a quick example of a few panels in the Beyla RED Metrics example dashboard: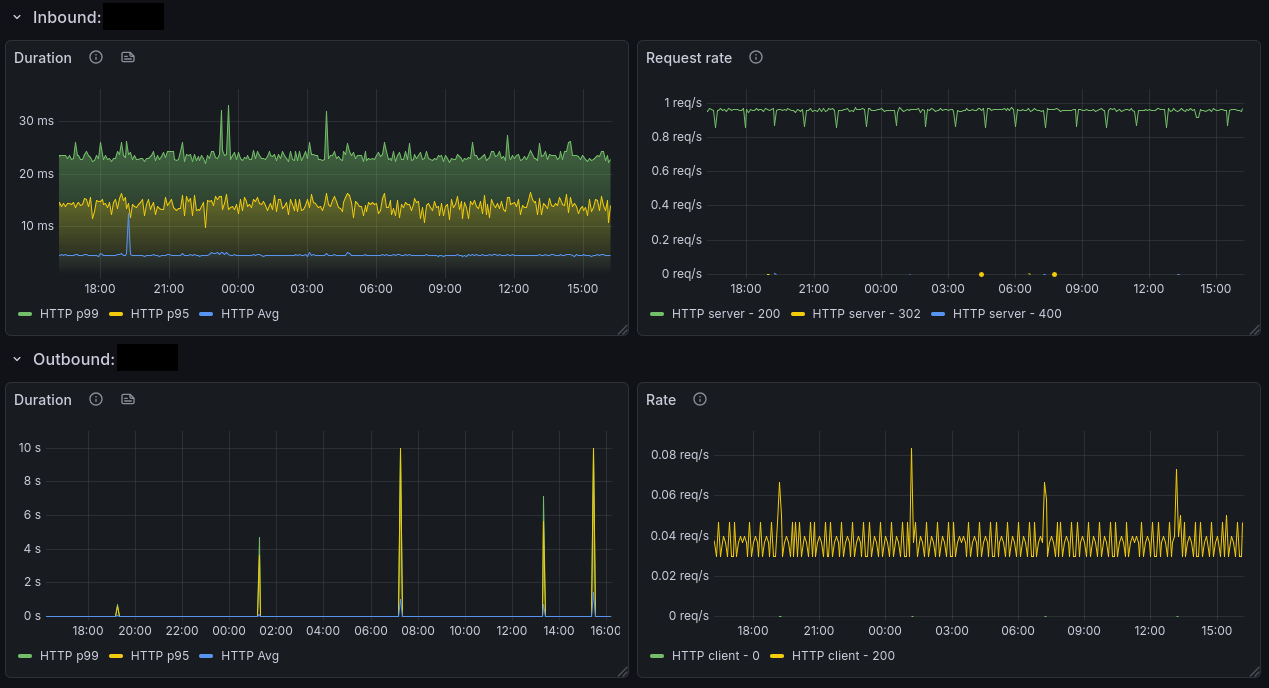
Conclusion#
With all this set up, I now have metrics, logs, and traces for services where I could previously only get logs, with very little setup required. It’s worth noting that while the metrics are limited to network traffic, if a service offers an API, you can often use an exporting script to convert that information to Prometheus metrics too.
The services I run aren’t necessarily full “black-boxes” either - they’re all open-source, so you could definitely inject OpenTelemetry’s other auto-instrumentation options, but that’s less fun.
There’s probably not a whole lot of practical use for this in my setup (besides “ooh graphs”), but for actual use cases where you need to monitor e.g. an old legacy application, it’s probably pretty great.